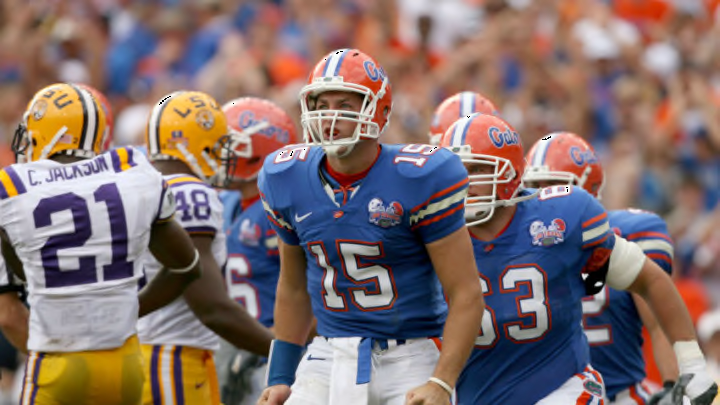
While Florida football won the national title in 2008, there is still a debate to be made on who should have won the Heisman that season.
The Heisman Memorial Trophy is the most prestigious individual award a college football player can receive. The award is given annually to the most outstanding player in college football. 870 media members vote on the award as well as 57 previous Heisman winners. With anything done by humans, there can be a large discrepancy in the votes. While there are many different years the Heisman Trophy has been debated, one of them is the 2008 award.
Sam Bradford would go on to win the award in 2008, and many fans speculate that the Heisman voters didn’t want to give Tim Tebow his second straight Heisman. Sam Bradford would finish with 1726 points. Colt McCoy would finish second with 1604 points, and Tim Tebow would come in third with 1575 points. But did Tim Tebow deserve to be a back-to-back Heisman winner? Let’s break it down.
Florida Football: Stats from 2008
The number one thing that goes into determining the winner of the Heisman is, undoubtedly, stats. If a player doesn’t have the stats to back up their season, they won’t win the Heisman. So did Tim Tebow or Sam Bradford have better stats in 2008? (All stats from SportsReference.com)
In 2008 Tim Tebow went 192-298 for 2,746, 30 touchdowns, and just 4 interceptions. He would finish with a 172.4 QBR. He would also rush 176 times for 673 yards and an extra 12 touchdowns.
Sam Bradford went 328-483 for 4720 yards, 50 touchdowns, and just 8 interceptions. He would add five touchdowns on the ground even though he only ran for 47 yards in 2008.
Comparing the stats is a no-brainer. Sam Bradford accounted for 55 touchdowns and nearly 5000 yards. Tim Tebow would account for 42 touchdowns and almost 3500 yards. While Tim Tebow’s numbers are nothing to scoff at, Sam Bradford takes it easily when comparing stats. But stats don’t always tell the whole story.
Schedule
Comparing schedules is something fans do every year. The main problem is that we compare teams’ schedules based on preseason rankings instead of looking at how tough their schedule was at the end of the year. So how tough were the schedules of Florida and Oklahoma in retrospect (the national title game is not included)?
The Florida Gators played 4 teams that would finish 2008 in the top 25.
vs. #14 Ole Miss (L) (30-31)
(Jacksonville) vs. #13 Georgia (W) (49-10)
@ #21 Florida State (W) (45-15)
vs. #6 Alabama (W) (31-20) (SEC Championship)
The Oklahoma Sooners played 6 teams that finished in the top 25.
vs. #17 Cincinnati (W) (52-26)
vs. #7 TCU (W) (35-10)
(Dallas) vs. #4 Texas (L) (35-45)
vs. #12 Texas Tech (W) (65-21)
@ #16 Oklahoma State (W) (61-41)
vs. #19 Missouri (W) (62-21) (Big 12 Championship
Florida and Oklahoma both played in their conference title games, had one neutral site game against a top 25 team, and one game on the road against a top 25 team. Oklahoma’s schedule was slightly tougher than Florida’s, as they played 2 more top-25 teams. Give the nod to Sam Bradford, but now we are going to break down the schedule even further.
Opposing Defenses
We’ve all heard the argument, “But that guy didn’t play any real defenses,” said college football fans before. Since both the guys we are talking about are offensive players that share the same position, it is fair to compare the defenses that each faced during the 2008 season. Once again, the title game was not considered in these calculations, and each team played one team that was not an FBS team at the time (Oklahoma played Chattanooga, and Florida football played The Citadel), and those games were not considered.
I looked at both teams’ schedules and found the average rank and average points per game that the opposing defense allowed.
Here’s a look at the defenses each team played in 2008.
The Florida Gators:
Opponent (Defensive Rank) (PPG Allowed)
Hawaii (83) (28.9)
Miami (57) (24.2)
Tennessee (10) (16.8)
Ole Miss (20) (19.0)
Arkansas (93) (31.2)
LSU (56) (24.2)
Kentucky (35) (21.5)
Georgia (58) (24.5)
Vanderbilt (21) (19.6)
South Carolina (31) (21.1)
Florida State (26) (20.2)
Alabama (7) (14.3)
On average, Florida played a defense that ranked 41st in the country, and the defenses they played gave up an average of 22.1 points per game.
Now let’s take a look at the defenses Oklahoma faced in the 2008 season.
Opponent (Defensive Rank) (PPG Allowed)
Cincinnati (25) (20.1)
Washington (116) (38.6)
TCU (2) (11.3)
Baylor (86) (29.3)
Texas (19) (18.8)
Kansas (82) (28.8)
Kansas State (111) (35.8)
Nebraska (80) (28.5)
Texas A&M (114) (37.4)
Texas Tech (73) (27.8)
Oklahoma State (76) (28.1)
Missouri (69) (27.2)
The Oklahoma Sooners faced defenses that ranked 71st in the country on average. The defenses they faced gave up 27.6 points per game.
The Gators faced tougher defenses than the Oklahoma Sooners did in 2008. While the five points per game difference don’t seem all that impressive, that’s nearly a touchdown difference every game. Sam Bradford was essentially gifted a free touchdown every game compared to Tim Tebow. Considering Sam Bradford finished 13 touchdowns clear of Tebow, they would have been nearly even had they played the same teams. This round goes to Tebow.
